


A nice graphical representation of the expansion of the Cryosphere of late...Global Warming, indeed!!!
Source: National Ice Center
Blogging the world around me.

Coverage of the meetings of the Macon County Board of County Commissioners.

Coverage of the meetings of the Franklin Town Board of Aldermen.

Coverage of the meetings of the Macon County School Board.

Photos from my photoblog.

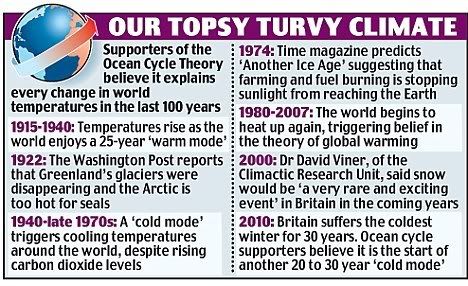
The bitter winter afflicting much of the Northern Hemisphere is only the start of a global trend towards cooler weather that is likely to last for 20 or 30 years, say some of the world’s most eminent climate scientists.
Their predictions – based on an analysis of natural cycles in water temperatures in the Pacific and Atlantic oceans – challenge some of the global warming orthodoxy’s most deeply cherished beliefs, such as the claim that the North Pole will be free of ice in
summer by 2013.
According to the US National Snow and Ice Data Centre in Colorado, Arctic summer sea ice has increased by 409,000 square miles, or 26 per cent, since 2007 – and even the most committed global warming activists do not dispute this.
They say that their research shows that much of the warming was caused by oceanic cycles when they were in a ‘warm mode’ as opposed to the present ‘cold mode’.
This challenge to the widespread view that the planet is on the brink of an irreversible catastrophe is all the greater because the scientists could never be described as global warming ‘deniers’ or sceptics.
However, both main British political parties continue to insist that the world is facing imminent disaster without drastic cuts in CO2.
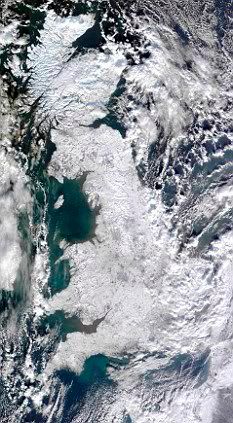 This image of the UK taken from NASA's multi-national Terra satellite on Thursday shows the extent of the freezing weather
Last week, as Britain froze, Climate Change Secretary Ed Miliband maintained in a parliamentary answer that the science of global warming was ‘settled’.
Among the most prominent of the scientists is Professor Mojib Latif, a leading member of the UN’s Intergovernmental Panel on Climate Change (IPCC), which has been pushing the issue of man-made global warming on to the international political agenda since it was formed 22 years ago.
Prof Latif, who leads a research team at the renowned Leibniz Institute at Germany’s Kiel University, has developed new methods for measuring ocean temperatures 3,000ft beneath the surface, where the cooling and warming cycles start.
He and his colleagues predicted the new cooling trend in a paper published in 2008 and warned of it again at an IPCC conference in Geneva last September.
Last night he told The Mail on Sunday: ‘A significant share of the warming we saw from 1980 to 2000 and at earlier periods in the 20th Century was due to these cycles – perhaps as much as 50 per cent.
'They have now gone into reverse, so winters like this one will become much more likely. Summers will also probably be cooler, and all this may well last two decades or longer.
"Global satellite data is analyzed for temperature trends for the period January 1979 through June 2009. Beginning and ending segments show a cooling trend, while the middle segment evinces a warming trend. The past 12 to 13 years show
cooling using both satellite data sets, with lower confidence limits that do not
exclude a negative trend until 16 years. It is shown that several published studies
have predicted cooling in this time frame. One of these models is extrapolated
from its 2000 calibration end date and shows a good match to the satellite data,
with a projection of continued cooling for several more decades."
The specific counties listed in the advisory are Avery, Buncombe, Graham, Haywood, Henderson, Jackson, Macon, Madison, Mitchell, Swain, Transylvania and Yancey.
The forecast through late next week calls for highs ranging between the mid-20s to upper-30s during the day, dipping to the teens at night. The normal lows for this time of year are around the mid- to upper-20s.
“There’s a strong area of high pressure over the middle of the country that came from central Canada,” National Weather Service meteorologist Bryan McAvoy said. “As long as the area of high pressure remains, it will continue to push cold air into the region.”
The cold weather has devastated the Scottish football schedule for the second week in a row.
Falkirk v St Johnstone survived a late inspection but Motherwell v Hamilton, also in the Scottish Premier League, is off after pipes burst at Fir Park.
In the Scottish Football League the three scheduled First Division games are victims of the freezing weather and all five Second Division games are off.
Queen's Park's late call-off means all Third Division fixtures are wiped out.
East Stirling v Elgin, Stranraer v Annan, Berwick Rangers v Livingston and Montrose v Forfar had all been postponed earlier, and the staff at Hampden were hopeful that the Spiders' game against Albion Rovers could have gone ahead after a major effort was made to clear ice and snow from around the ground.
But further snowfall in the south side of Glasgow has caused continuing problems in the Hampden area.
Beggars and homeless people had to spend the cold nights with little protection beyond plastic sheets and bags, reports said. State authorities were distributing blankets and firewood to the poor, police said.
Weather officials said there would be no respite from the cold weather and expect temperatures to fall further over the weekend.
Cold weather prevailed in northern states like Punjab and Haryana. The season's lowest temperature on the plains was reported from Amritsar, which recorded minus 0,2 degrees Celsius.
In the Himalayan region, several parts of Indian Kashmir and Himachal Pradesh temperatures dropped below zero.
Winters in India are brief, beginning in mid-December and ending by February.
The oceans are losing heat, so the Canadian wheat belt will just get colder and drier as Solar Cycle 24 progresses. As Mark Steyn recently said, anyone under the age of 29 has not experienced global warming. A Dalton Minimum repeat will mean that they will have to wait to the age of 54 odd to experience a warming trend.
Where to now? The F 10.7 flux continues to flatline. All the volatility has gone out of it. In terms of picking the month of minimum for the Solar Cycle 23/24 transition, I think the solar community will put it in the middle of the F 10.7 quiet period due to the lack of sunspots. We won’t know how long that quiet period is until solar activity ramps up again. So picking the month of minimum at the moment may just be guessing.
Dr Hathaway says that we are not in for a Maunder Minimum, and I agree with him. I have been contacted by a gentleman from the lower 48 who has a very good solar activity model. It hindcasts the 20th century almost perfectly, so I have a lot of faith in what it is predicting for the 21st century, which is a couple of very weak cycles and then back to normal as we have known it. I consider his model to be a major advance in solar science.

Scientists Issue Unprecedented Forecast of Next Sunspot Cycle
BOULDER—The next sunspot cycle will be 30-50% stronger than the last one and begin as much as a year late, according to a breakthrough forecast using a computer model of solar dynamics developed by scientists at the National Center for Atmospheric Research (NCAR). Predicting the Sun’s cycles accurately, years in advance, will help societies plan for active bouts of solar storms, which can slow satellite orbits, disrupt communications, and bring down power systems.
The scientists have confidence in the forecast because, in a series of test runs, the newly developed model simulated the strength of the past eight solar cycles with more than 98% accuracy. The forecasts are generated, in part, by tracking the subsurface movements of the sunspot remnants of the previous two solar cycles. The team is publishing its forecast in the current issue of Geophysical Research Letters.
May 29, 2009: An international panel of experts led by NOAA and sponsored by NASA has released a new prediction for the next solar cycle. Solar Cycle 24 will peak, they say, in May 2013 with a below-average number of sunspots.
"If our prediction is correct, Solar Cycle 24 will have a peak sunspot number of 90, the lowest of any cycle since 1928 when Solar Cycle 16 peaked at 78," says panel chairman Doug Biesecker of the NOAA Space Weather Prediction Center.
Source: NASA
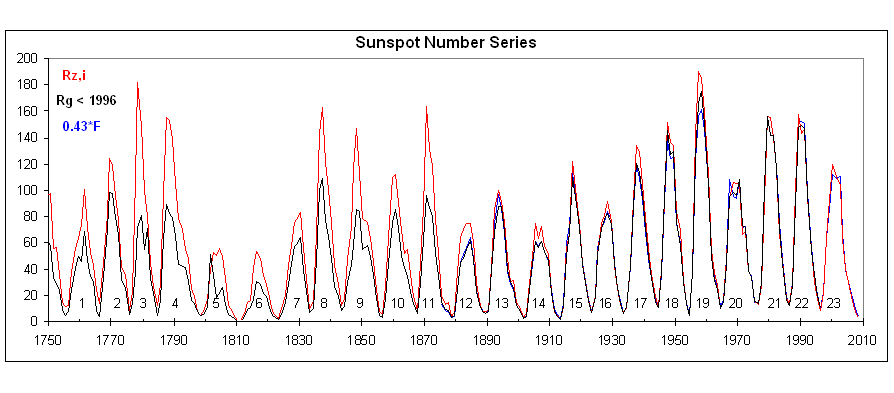
I wonder if these "scientists" have even taken a moment of their time to look at the following chart of sunspot cycles in their zeal to predict a solar cycle that means the earth will be warning...

The April 2009 temperature for the contiguous United States was below the long-term average, based on records going back to 1895, according to an analysis by NOAA’s National Climatic Data Center in Asheville, NC.
The average April temperature of 51.2 degrees F was 0.8 degree F below the 20th Century average. Precipitation across the contiguous United States in April averaged 2.62 inches, which is 0.19 inch above the 1901-2000 average.
-SNIP-
U.S. Temperature Highlights
April temperatures were near normal across much of the United States. On a regional scale, only the Northeast (above-normal) and the West North Central (below-normal) deviated significantly from the norm.
New Hampshire observed its eighth warmest April, based on data going back to 1895. Unlike much of the Northeast, the Midwest experienced a cooler-than-normal month. From North Dakota southward to Oklahoma, Missouri, Louisiana, Alabama and Georgia, temperature averages were below normal.
For the year-to-date period, only two states, North Dakota and Washington, have experienced cooler-than-normal average temperatures. In contrast, much of the South and Southwest regions were above-normal. New Mexico had its ninth warmest such period on record.
Based on NOAA's Residential Energy Demand Temperature Index, the contiguous U.S. temperature-related energy demand was 2.3 percent below average in April.
-SNIP
Other Highlights
- International Falls, Minn., recorded 125 inches of snow so far this winter season, breaking the previous record of 116 inches set in the 1995-1996 winter season. Another seasonal snowfall record was broken in Spokane, Wash., where 97.7 inches of snowfall broke the old record of 93.5 inches set in 1915-1916.
- About eight percent of the contiguous U.S. was covered by snow at end of April, according to an analysis by the National Operational Hydrologic Remote Sensing Center. Snow coverage during the month peaked at 30.2 percent on April 6, after a late-season winter storm hit the Midwest and Plains.
- The 263 preliminary tornadoes reported in April was above the three-year average of 200 confirmed tornadoes.

This year, Earth Hour has been transformed into the world’s first global election, between Darkness and Light.
For the first time in history, people of all ages, nationalities, race and background have the opportunity to use their light switch as their vote – Switching off your lights is a vote for the Dark Evil of Environmentalism, turning them on is a vote for the Light of Reason and against the fear-mongering environmentalists. I am urging the world to VOTE LIGHT and diminish the wacko agenda of the WWF. Their target is to reach the target of 1 billion votes, which will be presented to world leaders at the Global Climate Change Conference in Copenhagen 2009.
This meeting will determine official government policies to take action against global warming, which will replace the Kyoto Protocol. It is the chance for the people of the world to make their voice heard.
Earth Hour began in Sydney in 2007, when 2.2 million homes and businesses switched off their lights for one hour. In 2008 the message had grown into a global sustainability movement, with 50 million people switching off their lights. Global landmarks such as the Golden Gate Bridge in San Francisco, Rome’s Colosseum, the Sydney Opera House and the Coca Cola billboard in Times Square all stood in darkness.
We can turn the tide on this stupidity...turn on every light in your house, and turn on the outside floodlights if you have them. As a bonus, you can also turn on every Television and Radio in your home. Turn up the heat or A/C depending on your location. Turn on your vehicle and let it idle for a few minutes during this hour.
It is time we stopped being mute, and doing nothing in the face of this environmental extremism. We must begin to cancel out their activities and Stand Up to them...and expose them as the idiots that they are!!!
Who is with me?

The intimidation tactics and belittling words of those in global warming alarmism are only a means to cloak the weaknesses of their arguments, especially now that the scientific and economic evidence has found a broader, more receptive audience -- check the latest poll results if you don't believe me.
Put succinctly, their efforts to silence opposing viewpoints to their dogma have only proven that they are a bunch of chicken-twits. Now that doubting Dorothy has doused Elmira Gulch's other ego with a cocktail of moderating temperatures and an economy in distress, the cries that their forecasts are "melting, melting, aagghhhh" approach a shrill peak.
What has happened in Arkansas the last few weeks is illustrative...
Source: Paul Chesser, writing in American Spectator

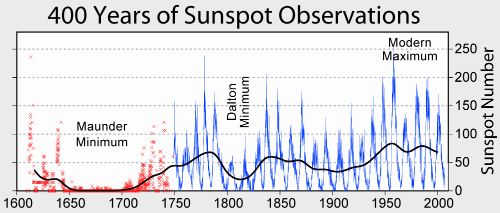
The Solar Cycle: Sunspots increase and decrease through an average cycle of 11 years. Dating back to 1749, we have experienced 22 full solar cycles where the number of sunspots have gone from a minimum, to a maximum and back to the next minimum, through approximate 11 year cycles. We are now well into the 23rd cycle, with the 24th cycle right around the corner. The number of sunspots in this cycle reached a peak in May, 2000 where the number of sunspots were measured at near 170. A secondary sunspot maximum occurred near the beginning of 2002 where the sunspot number was about 150. The next sunspot minimum is forecast to occur in late 2006 through mid 2007. A chart of cycle 23 is available at the NOAA Space Environment Center.
Let me remind you...it's January 2009, and we are still seeing a very low sunspot count. In fact, one so low for so long a period of time, that there is some concern that we could be in for another long term period of decreased sunspots like a Dalton or Maunder Minimum. Ice Age, anyone?
I have blogged about this possibility at least since October of 2007, and became aware of the possibility of a Landscheit Minimum in June of last year.


CROWD FUNDING
If you're of a mind, and can afford it, a dollar a month (or more) from enough people will make a huge difference in improving the quality of coverage of local meetings and events, as well as allowing remote weather stations and weather cams to be deployed throughout the county that you will be able to access online.
Currently, 20 people have pledged $99 a month. This is a tremendous help. Please visit www.patreon.com/MaconMedia for more information on how to contribute.
Businesses can underwrite this coverage by day sponsorships, surplus equipment donations, etc. Inquire at editor@maconmedia.com for more information.


