


There are many people tracking what may be the beginning of a new temperture trend...downward. Among them, comes this report:
That comes from Digital Diatribes, who does yeoman's work on tracking numbers, building spreadsheets and graphs.
The latest UAH anomaly is -0.114. On the heels of a -0.183 reading for May, this is the steppest 2-month negative anomaly since Sept/Oct 1993. It’s the lowest 3-month anomaly since 1997. The latest reading gives 10 consecutive year-over-year anomalies that are lower than previous year. The last such stretch was in the period beginning May 1999. The negative trend line goes back to July 1997 - exactly 11 years.
And from another Digital Warrior, comes this graph:
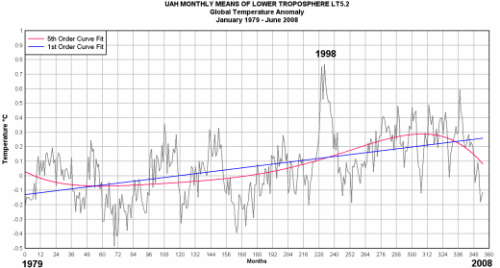
The graph plots the long term trend [1st order curve in blue] against the short term trend [5th order curve in red].
Source: Watts Up With That?
The long term trend line is simply a first-order curve [line] from the beginning temperature to the ending temperature, and it treats all the ups and downs in between as random noise, and the short term trend takes into account more of the data using a fifth-order curve; and is one of the form fx5 + ex4 + dx3 + cx2 + bx + a, and is much more robust for fitting temperature trends.
The fifth-order curve is a leading indicator that can indicate the future direction of the first-order curve. Of course, my bet is that the Global Warming Religionists will simply move their beginning plot back to the Little Ice Age like some of the commenters have suggested.
Since no one seems to be plotting the moving averages of the data like I do for stock prices, I wonder if there would be any utility in doing that.
I still remember the predictions by NASA that Solar Cycle 24 was going to be "one of the most intense cycles since record-keeping began almost 400 years ago" and here we are, two years late for the solar minimum, and the sun the most quiescent in a very long time. A few Solar Cycle 24 sunspots appeared in January, but their number has been few and far between, with Solar Cycle 23 sunspots still appearing at a greater frequency than the 24 spots. The solar minimum is measured at the point in time where the spots of the new cycle out number the spots of the old cycle. It has been two months since the last Cycle 24 spot.NASA is still standing by their already outdated April 2007 forecast.
The current sunspot number is 0.
I wonder when the Legacy Media will start to notice that the predictions of the Global Warming Religionists are not coming to pass?


0 comments :
Post a Comment