


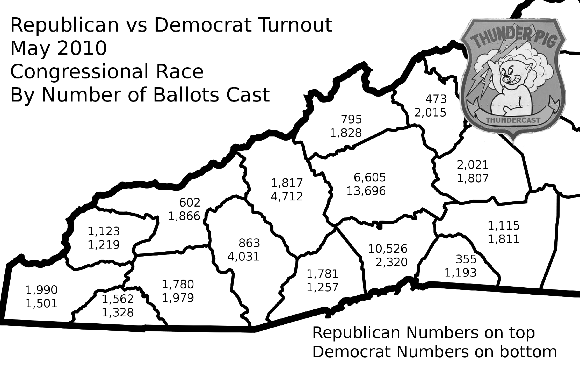
Here is yet another way to look at the numbers from the May 4th, 2010 primary results in regards to the Congressional race.
While you look at these numbers, take into account that the Republican race had six men vying for votes. Six campaigns were tasked with motivating people to cast a ballot for their candidate. On the Democrat side of the aisle, there were only two candidates in the race.
In my estimation, the Republican candidates failed miserably in their task of motivating people to cast ballots for them.
My reasoning behind this includes the conventional wisdom that this is supposed to be a banner year for the Republican party. Looking at just our congressional district, I can't tell.
These numbers include updated data from the North Carolina State Board of Elections.
Next, I'll deal with how the various campaigns performed.
Previously:


0 comments :
Post a Comment