Notice

I am working on the template of this blog today in order to chase down some problems that have developed with my template and widgets.

Macon County Commissioners

Coverage of the meetings of the Macon County Board of County Commissioners.

Franklin Town Board of Aldermen

Coverage of the meetings of the Franklin Town Board of Aldermen.

Macon County School Board

Coverage of the meetings of the Macon County School Board.

Photoblog

Photos from my photoblog.

nullspace for future use

nullspace for future use

About

Showing posts with label Solar Cycle 24. Show all posts

Monday, April 22, 2013

SDO: Three Years of Solar Observing in Three Minutes

SDO Three Years in Three Minutes

Here is a beautiful thing:


From the video description:

In the three years since it first provided images of the sun in the spring of 2010, NASA's Solar Dynamics Observatory (SDO) has had virtually unbroken coverage of the sun's rise toward solar maximum, the peak of solar activity in its regular 11-year cycle. This video shows those three years of the sun at a pace of two images per day.

SDO's Atmospheric Imaging Assembly (AIA) captures a shot of the sun every 12 seconds in 10 different wavelengths. The images shown here are based on a wavelength of 171 Angstroms, which is in the extreme ultraviolet range and shows solar material at around 600,000 Kelvin. In this wavelength it is easy to see the sun's 25-day rotation as well as how solar activity has increased over three years.

During the course of the video, the sun subtly increases and decreases in apparent size. This is because the distance between the SDO spacecraft and the sun varies over time. The image is, however, remarkably consistent and stable despite the fact that SDO orbits the Earth at 6,876 miles per hour and the Earth orbits the sun at 67,062 miles per hour.

Such stability is crucial for scientists, who use SDO to learn more about our closest star. These images have regularly caught solar flares and coronal mass ejections in the act, types of space weather that can send radiation and solar material toward Earth and interfere with satellites in space. SDO's glimpses into the violent dance on the sun help scientists understand what causes these giant explosions -- with the hopes of some day improving our ability to predict this space weather.


There are several noteworthy events that appear briefly in this video. They include the two partial eclipses of the sun by the moon, two roll maneuvers, the largest flare of this solar cycle, comet Lovejoy, and the transit of Venus. The specific time for each event is listed below, but a sharp-eyed observer may see some while the video is playing.

00:30;24 Partial eclipse by the moon

00:31;16 Roll maneuver

01:11;02 August 9, 2011 X6.9 Flare, currently the largest of this solar cycle

01:28;07 Comet Lovejoy, December 15, 2011

01:42;29 Roll Maneuver

01:51;07 Transit of Venus, June 5, 2012

02:28;13 Partial eclipse by the moon

More information about this video, as well as full HD version of all four wavelengths and print-resolution stills are public domain and can be viewed and downloaded at: http://svs.gsfc.nasa.gov/vis/a010000/a011200/a011255/

This video is public domain and can be downloaded.

Like our videos? Subscribe to NASA's Goddard Shorts HD podcast:
http://svs.gsfc.nasa.gov/vis/iTunes/f0004_index.html

Or find NASA Goddard Space Flight Center on Facebook:
http://www.facebook.com/NASA.GSFC

Or find us on Twitter:
http://twitter.com/NASAGoddard

Monday, January 11, 2010

Mini Ice Age to Last Another 20 to 30 Years?


The Ocean Cycle Theory

The bitter winter afflicting much of the Northern Hemisphere is only the start of a global trend towards cooler weather that is likely to last for 20 or 30 years, say some of the world’s most eminent climate scientists.

Their predictions – based on an analysis of natural cycles in water temperatures in the Pacific and Atlantic oceans – challenge some of the global warming orthodoxy’s most deeply cherished beliefs, such as the claim that the North Pole will be free of ice in
summer by 2013.

According to the US National Snow and Ice Data Centre in Colorado, Arctic summer sea ice has increased by 409,000 square miles, or 26 per cent, since 2007 – and even the most committed global warming activists do not dispute this.


They say that their research shows that much of the warming was caused by oceanic cycles when they were in a ‘warm mode’ as opposed to the present ‘cold mode’.

This challenge to the widespread view that the planet is on the brink of an irreversible catastrophe is all the greater because the scientists could never be described as global warming ‘deniers’ or sceptics.

However, both main British political parties continue to insist that the world is facing imminent disaster without drastic cuts in CO2.


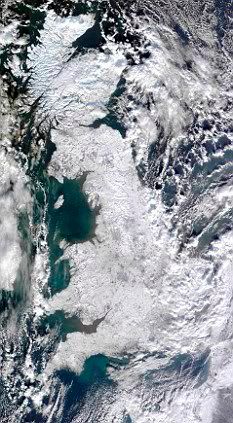
This image of the UK taken from NASA's multi-national Terra satellite on Thursday shows the extent of the freezing weather

Last week, as Britain froze, Climate Change Secretary Ed Miliband maintained in a parliamentary answer that the science of global warming was ‘settled’.

Among the most prominent of the scientists is Professor Mojib Latif, a leading member of the UN’s Intergovernmental Panel on Climate Change (IPCC), which has been pushing the issue of man-made global warming on to the international political agenda since it was formed 22 years ago.

Prof Latif, who leads a research team at the renowned Leibniz Institute at Germany’s Kiel University, has developed new methods for measuring ocean temperatures 3,000ft beneath the surface, where the cooling and warming cycles start.

He and his colleagues predicted the new cooling trend in a paper published in 2008 and warned of it again at an IPCC conference in Geneva last September.

Last night he told The Mail on Sunday: ‘A significant share of the warming we saw from 1980 to 2000 and at earlier periods in the 20th Century was due to these cycles – perhaps as much as 50 per cent.

'They have now gone into reverse, so winters like this one will become much more likely. Summers will also probably be cooler, and all this may well last two decades or longer.


Source: UK Daily Mail


"Global satellite data is analyzed for temperature trends for the period January 1979 through June 2009. Beginning and ending segments show a cooling trend, while the middle segment evinces a warming trend. The past 12 to 13 years show
cooling using both satellite data sets, with lower confidence limits that do not
exclude a negative trend until 16 years. It is shown that several published studies
have predicted cooling in this time frame. One of these models is extrapolated
from its 2000 calibration end date and shows a good match to the satellite data,
with a projection of continued cooling for several more decades."


Commentary


A cooling ocean cycle combined with a cooling trend from the sun should be a double-whammy to our climate that should continue for the next couple of decades...

It is my opinion that the claims of the 'scientists' supporting Global Warming are based in political need to have a scientific basis to stop us from using fossil fuels for energy production, and I believe that the ClimateGate e-mails should at least prove to anyone with a modicum of common sense that the supporters of Global Warming are acting more like people making up lies to support a superstition than scientists.

Wednesday, July 29, 2009

NASA now admits that a Dalton Minimum is possible


Graphic courtesy Wikipedia Commons


What a difference two or three years make!

It appears that NASA may be pulling it's help out of the sandbox built by lefty enviro-whackos.

From David Archidbald:

The oceans are losing heat, so the Canadian wheat belt will just get colder and drier as Solar Cycle 24 progresses. As Mark Steyn recently said, anyone under the age of 29 has not experienced global warming. A Dalton Minimum repeat will mean that they will have to wait to the age of 54 odd to experience a warming trend.

Where to now? The F 10.7 flux continues to flatline. All the volatility has gone out of it. In terms of picking the month of minimum for the Solar Cycle 23/24 transition, I think the solar community will put it in the middle of the F 10.7 quiet period due to the lack of sunspots. We won’t know how long that quiet period is until solar activity ramps up again. So picking the month of minimum at the moment may just be guessing.

Dr Hathaway says that we are not in for a Maunder Minimum, and I agree with him. I have been contacted by a gentleman from the lower 48 who has a very good solar activity model. It hindcasts the 20th century almost perfectly, so I have a lot of faith in what it is predicting for the 21st century, which is a couple of very weak cycles and then back to normal as we have known it. I consider his model to be a major advance in solar science.


As I've been blogging for the past four years...the evidence is mounting and it is looking to get even cooler.

Sunday, May 31, 2009

FOR SALE: One 2006 Predictive Flux-transport Dynamo Model. Make offer…


Scientists Issue Unprecedented Forecast of Next Sunspot Cycle

BOULDER—The next sunspot cycle will be 30-50% stronger than the last one and begin as much as a year late, according to a breakthrough forecast using a computer model of solar dynamics developed by scientists at the National Center for Atmospheric Research (NCAR). Predicting the Sun’s cycles accurately, years in advance, will help societies plan for active bouts of solar storms, which can slow satellite orbits, disrupt communications, and bring down power systems.

The scientists have confidence in the forecast because, in a series of test runs, the newly developed model simulated the strength of the past eight solar cycles with more than 98% accuracy. The forecasts are generated, in part, by tracking the subsurface movements of the sunspot remnants of the previous two solar cycles. The team is publishing its forecast in the current issue of Geophysical Research Letters.


Read the rest at Watts Up With That? and be sure to read it to the very end. I swiped the title of this post from a comment on the same site.

What brought this up is the news that NOAA has revised their earlier prediction of an active sunspot cycle downward. In my opinion, not downward enough...but they still have time to revise their figures again, and again. Previous predictions [2006] had the sunspot numbers being between 150 and 200.

**8.32am** Check out this animated gif.

**8.47am** Digital Diatribes has another excellent post of the temperature data he has been analyzing and graphing. (The numbers don't lie).

Here is a snippet of the latest from NOAA:

May 29, 2009: An international panel of experts led by NOAA and sponsored by NASA has released a new prediction for the next solar cycle. Solar Cycle 24 will peak, they say, in May 2013 with a below-average number of sunspots.

"If our prediction is correct, Solar Cycle 24 will have a peak sunspot number of 90, the lowest of any cycle since 1928 when Solar Cycle 16 peaked at 78," says panel chairman Doug Biesecker of the NOAA Space Weather Prediction Center.

Source: NASA

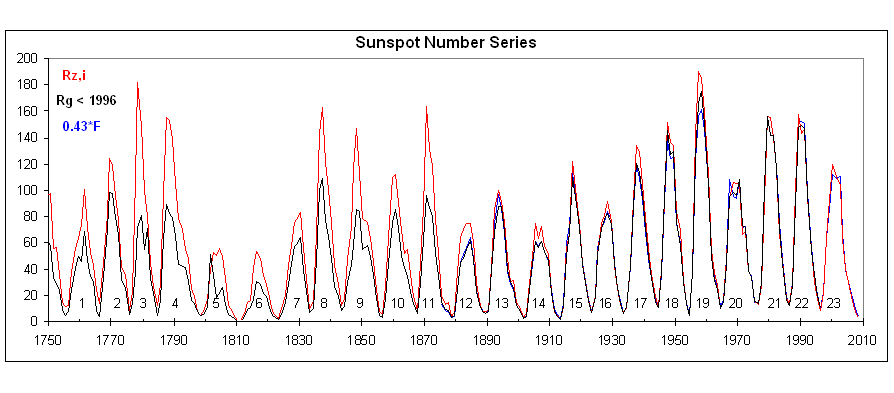
I wonder if these "scientists" have even taken a moment of their time to look at the following chart of sunspot cycles in their zeal to predict a solar cycle that means the earth will be warning...


**9.52am** I have been informed that even the graph above is misleading...that the scientists have replaced the more accurate Wolf Number with the Group Number to make the modern sunspot numbers look even greater than they are...please find a better graph below:


Click Image for larger version


Source: Solar Cycle 24
Hat Tip: Scarlet Girl

Saturday, February 14, 2009

Solar Cycle 24: Code Blue Alert


The graph above is of two year windows of the F 10.7 radio flux centered on the last five solar minima.  They are stacked up so that they are 20 solar flux units apart on the same vertical scale.  The original data is from: http://www.ngdc.noaa.gov/stp/SOLAR/ftpsolarradio.html#qbsa


Just a reminder to the lefties that there is evidence that the sun affects our climate far more than we do, and the next few years look to be a continuance of the cooling trend.